

Open Telemetry and Lambda are topics that I’ve spent a lot of brain cycles on over the past few weeks. Most of my work with these topics has been with Rust but I want to take a look at where my opinions are at the moment and hope to provide some insights that you can use to build your next Lambda with solid telemetry. For disclosure, I have some opinionated biases that will surface and I also still have some gaps in my exploration that I’ll highlight. Let’s get going with Open Telemetry and Lambda.
Setting the Stage
Before diving directly into Open Telemetry and Lambda, I want to share my definition of Observability.
Observability is the ability to view the current or past state of a system at different levels in the architecture to understand its performance, durability, and reliability.
I then describe the pillars of Traces, Logs, and Metrics like this.
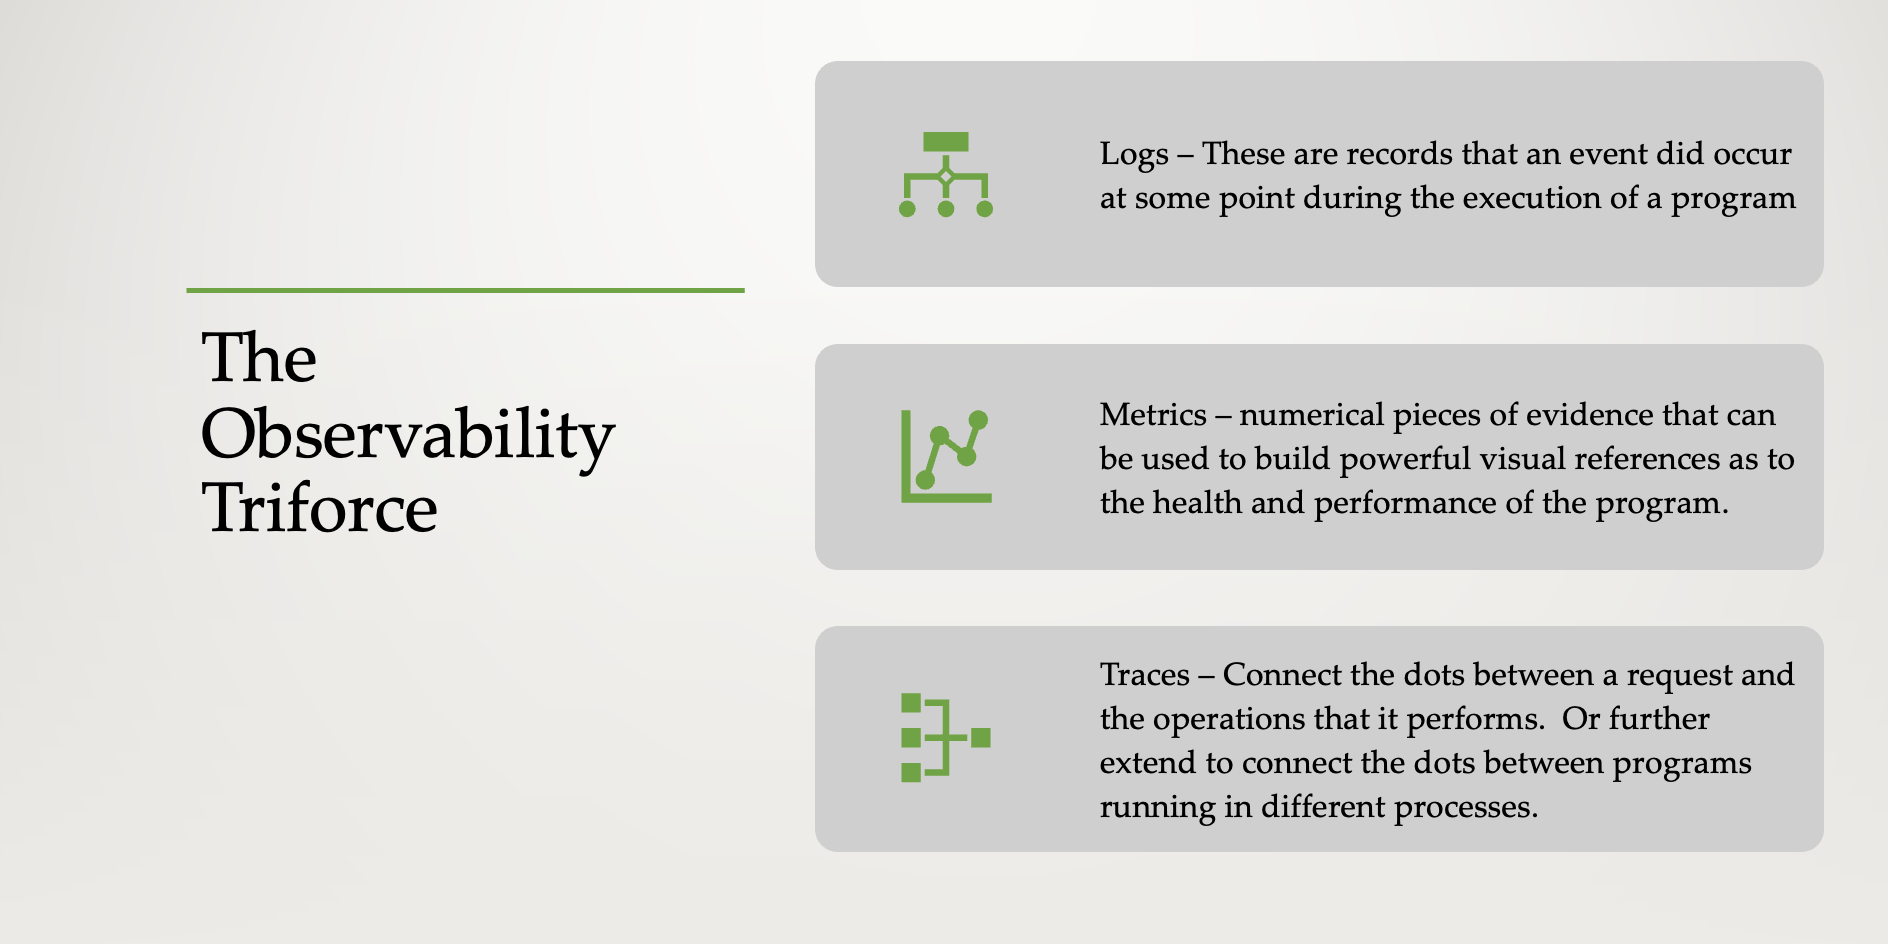
Why does Open Telemetry Exist?
There are many vendors in the Observability space but the Open Telemetry project exists to provide a vendor-neutral path toward making software observable. But why does that even matter? Observability matters because without it, troubleshooting systems in the cloud becomes next to impossible with any amount of load. For a more in-depth study of this, pause and go read that article first. To wrap up the why, here is how it defines itself.
OpenTelemetry is a collection of APIs, SDKs, and tools. Use it to instrument, generate, collect, and export telemetry data (metrics, logs, and traces) to help you analyze your software’s performance and behavior. — Open Telemetry
Where to Begin
The state of affairs. My top-level opinion at this point as it relates to Lambda and Observability is that leveraging Open Telemetry is going to come with some trade-offs that need to be weighed against the benefits. I also believe that you can’t run in production without observability so it’s worth the trade-offs. So speaking of those trade-offs, let’s get into Open Telemetry and Lambda.
Observability isn’t Free
For clarity, this is true whether I choose Open Telemetry with Lambda or whether I choose a vendor’s SDK with Lambda. The developer is responsible for creating traces, creating spans, and then tying everything together through logs and metrics. This happens to be the case whether I’m using Open Telemetry and Lambda or a vendor’s SDK. Now I’ve seen some implementations that are better than others, but it’s still work.
This is a generalization, but I’ve seen more hands-off approaches with languages like TypeScript, Python, and Java where many libraries will “auto” instrument code through various tricks and injections. I think this works well if you are just getting started, but I’d lean towards understanding what these abstractions are doing.
My next point about all of this is that having good clean observability is more about standards and discipline and less about technology. This again is because it doesn’t take much to wire up, but it’s more code that I must maintain. The metrics and traces I want to see in my visualizations have to be coded in my functions and handlers. My advice to anyone looking to up their observability position is to make the review of observability a part of the automated or manual Pull Request Review.
Sending Directly vs Collector
There’s some nuance to my opinions on the distinction between using a collector vs sending telemetry directly to an aggregator.
Note on Containers
When collecting Open Telemetry inside of a container, the collector is my preferred approach for this simple reason. Having a sidecar implementation allows my code to perform web requests or event requests in one space and then at its leisure it can ship telemetry over to the sidecar. Then, my code no longer cares about what happens to the telemetry. It’s done its job. It is 100% up to the collector at that point to handle the telemetry shipping. Any failures or performance issues won’t affect my running service code.
So far, I’ve had success shipping telemetry from the AWS Open Telemetry Distribution and the Datadog Agent. My Open Telemetry code does what I need it to do and then the collector does its thing.
Open Telemetry and Lambda Shipping
To contrast this with containers, Open Telemetry and Lambda requires me to make trade-offs. Using the collector is the best way to send telemetry to an aggregator, but in a Lambda that is a more complicated decision.
In the above two collectors, I’m required to run them as an extension.
Issues with Collector Extensions
First off, I’m not a fan of extensions. They add extra code that runs on top or next to my Lambda. They add start-up latency and increase my cost. With using someone else’s code, I have no option to improve that performance and I’m relying on someone else to make things faster and cheaper.
Second, they are limited in what they can do as of this writing of course.
The ADOT can only ship to X-Ray, CloudWatch, and an external API Endpoint. You might read somewhere that there is a supported Datadog exporter among others. That’s true when running the non-Lambda version. The full collector does have more capabilities. It also only deals with traces so if you want logs and metrics going somewhere else, you might still need an additional Lambda extension which means I’m now running multiple extensions on one Lambda. Extensions also share resources with my code so my memory plans and CPU needs now increase even further.
The Datadog extension on the other hand does a nice job of pulling the traces, logs, and metrics together in a single extension but I’m then again limited in that it’s only going to work for Datadog. Additionally, this isn’t supported and I’ve only been able to get this working by reading a great deal of Go code in GitHub. I’m hoping that this support is official at some point.
Regardless, extensions add start-up time, they require more resources and they will cost more to operate my Lambdas. They also aren’t fully featured across the board. AWS’ has a ton of promise, but it’s not where I feel comfortable yet.
Issues with Direct Sending
With Open Telemetry and Lambda, every SDK library I’ve seen allows the native shipping of telemetry to the aggregation endpoint. My friend Boris Tane over at Baselime does this amazingly well as do Honeycomb and some others. What Baselime does is actually very impressive and simplifies Open Telemetry-based observability with Lambda.
My main issue with direct sending is that my Lambda must ship these traces before I return my function handler. This means that my observability is coupled with my business functionality any latency that is incurred in shipping telemetry will be felt by my client. The risk is honestly the same as shipping to an extension but at least with the extension, the shipping is less likely to fail and less likely to be impacted by across-the-wire latency as everything with extensions is over a local network.
Shipping Thoughts
There isn’t a right answer here and it’s going to depend on comfort, vendor aggregator, and how much auto-instrumentation can be used. My point with all of the above is that shipping Open Telemetry and Lambda assets isn’t an always do this type of problem. There is a great deal of variability that stems from non-functional requirements and the programming language/framework that’s being used.
My last thought on this is that in what I’ve worked with, sticking closer to languages that allow executables to be mutated at runtime seems to have auto-instrumentation and magic that can be used vs something like Rust or Go.
The bottom line, know your tools, know your runtime, and know your requirements.
Summarizing the State of Affairs
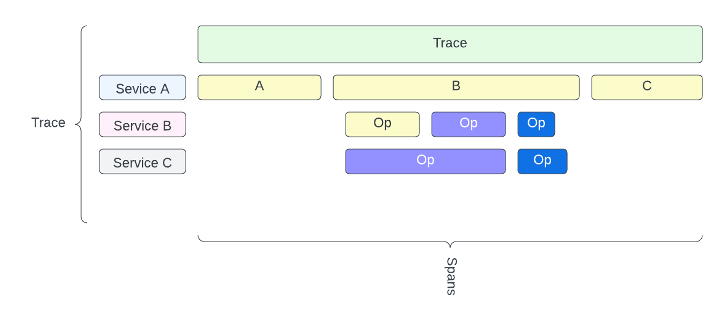
Observability is a requirement for any software that is deployed. I’ve been on too many projects where even logging wasn’t standardized or correctly implemented. Now imagine a scenario with a distributed system in which multiple services are required to operate on a client’s behalf. A 3 service setup might look like this.
I’ve found that certain languages are easier to work with in Lambda than others. My love for Rust is well-documented at this point, but there aren’t any good examples of how to instrument Lambdas coded in Rust leveraging Open Telemetry. That lack of documentation is what has spurred me to collect all of these opinions about the state of Open Telemetry and Lambda.
If you are implementing Open Telemetry and Lambda, you are going to need to make some choices and trade-offs and then measure. Measure your telemetry to see how it impacts client performance. Find the aggregator that you enjoy. I don’t believe vendor lock-in is a bad thing here because all of the paid vendors give you more than the open source alternatives. But I do believe that figuring out what you need is worth the investment of time to make sure that there’s a balance between cost and speed.
The ultimate hot take here is that IF portability is the most important thing, pick a vendor that supports the below endpoints. Put those endpoints in an environment variable that can be swapped out at a later date. And then only use the Open Telemetry SDKs so that at any point, you can pivot.
- Traces: “http://my-api-endpoint/v1/traces“
- Metrics: “http://my-api-endpoint/v1/metrics“
- Logs: “http://my-api-endpoint/v1/logs“
If feature capability is the thing you are shopping on, then you won’t get a better experience than by leaning into a vendor, using their SDK, and forgoing the portability of Open Telemetry for that deep integration. You’ll get the most out of what you are looking for but it’ll come at the cost of portability and the innovation roadmap of that vendor.
Decisions decisions. Lots to consider and I’ll have more on these topics as I explore Rust, Lambda, and Open Telemetry in future articles.
Thanks for reading and happy building!