
Event-Driven architecture paired with Serverless technologies are a powerful combo to build applications. But failure does happen and you should expect it to happen. Dealing with that failure is often done by dead-lettering messages into a Dead-Letter-Queue. But what do you do in order to monitor those queues? Most people start manually checking them or perhaps adding a CloudWatch Alarm that triggers an SNS topic. What I’d like to show you is a more advanced version of this monitoring through some code, constructs and AWS CodeSuite of tools. Say hello to monitoring SQS with Datadog.
Background and Setup
If you don’t know, I’ve been a fan and user of Datadog’s tools going on 4 years now. I was honored to be included in the inaguaral class of Datadog Ambassadors this summer as well. So it should be no surprise that when I wanted to give my teams some capabilities around monitoring their queues, Datadog was right in the middle of that design.
To take the design one step further, I’ve been using Slack as the medium for communicating alerts from Datadog because I can then use Slack’s capabilities to alert and collaborate with the people that need to address the issue. When running through this article and all of the code that’s attached, you’ll need a few things from a dependency standpoint but I’ll address those as we hit them.
Monitoring SQS with Datadog Design
When working with Event-Driven designs, failure happens. Things are eventually consistent by nature. Which means that you’ve got to pay attention to that failure. In most cases, have a Dead-Letter Queue with a decently long message retention policy makes sense. I wrote about how to deal with redrives using Golang and Step Functions a while back so this is an approach addressing problems. But how does one know there are problems? AWS’ SQS has a metric on a queue that is called ApproximateNumberOfMessagesVisible. When using a DLQ (Dead-Letter queue), there is some number that when your depth is greater than you need to do something. For critical systems, > 1 is that point, for other systems it might be > 100. Your architecture will vary.
But one thing is for certain, how do you know that something is alarming and that you will receive a notification? Monitoring SQS with Datadog is an approach.
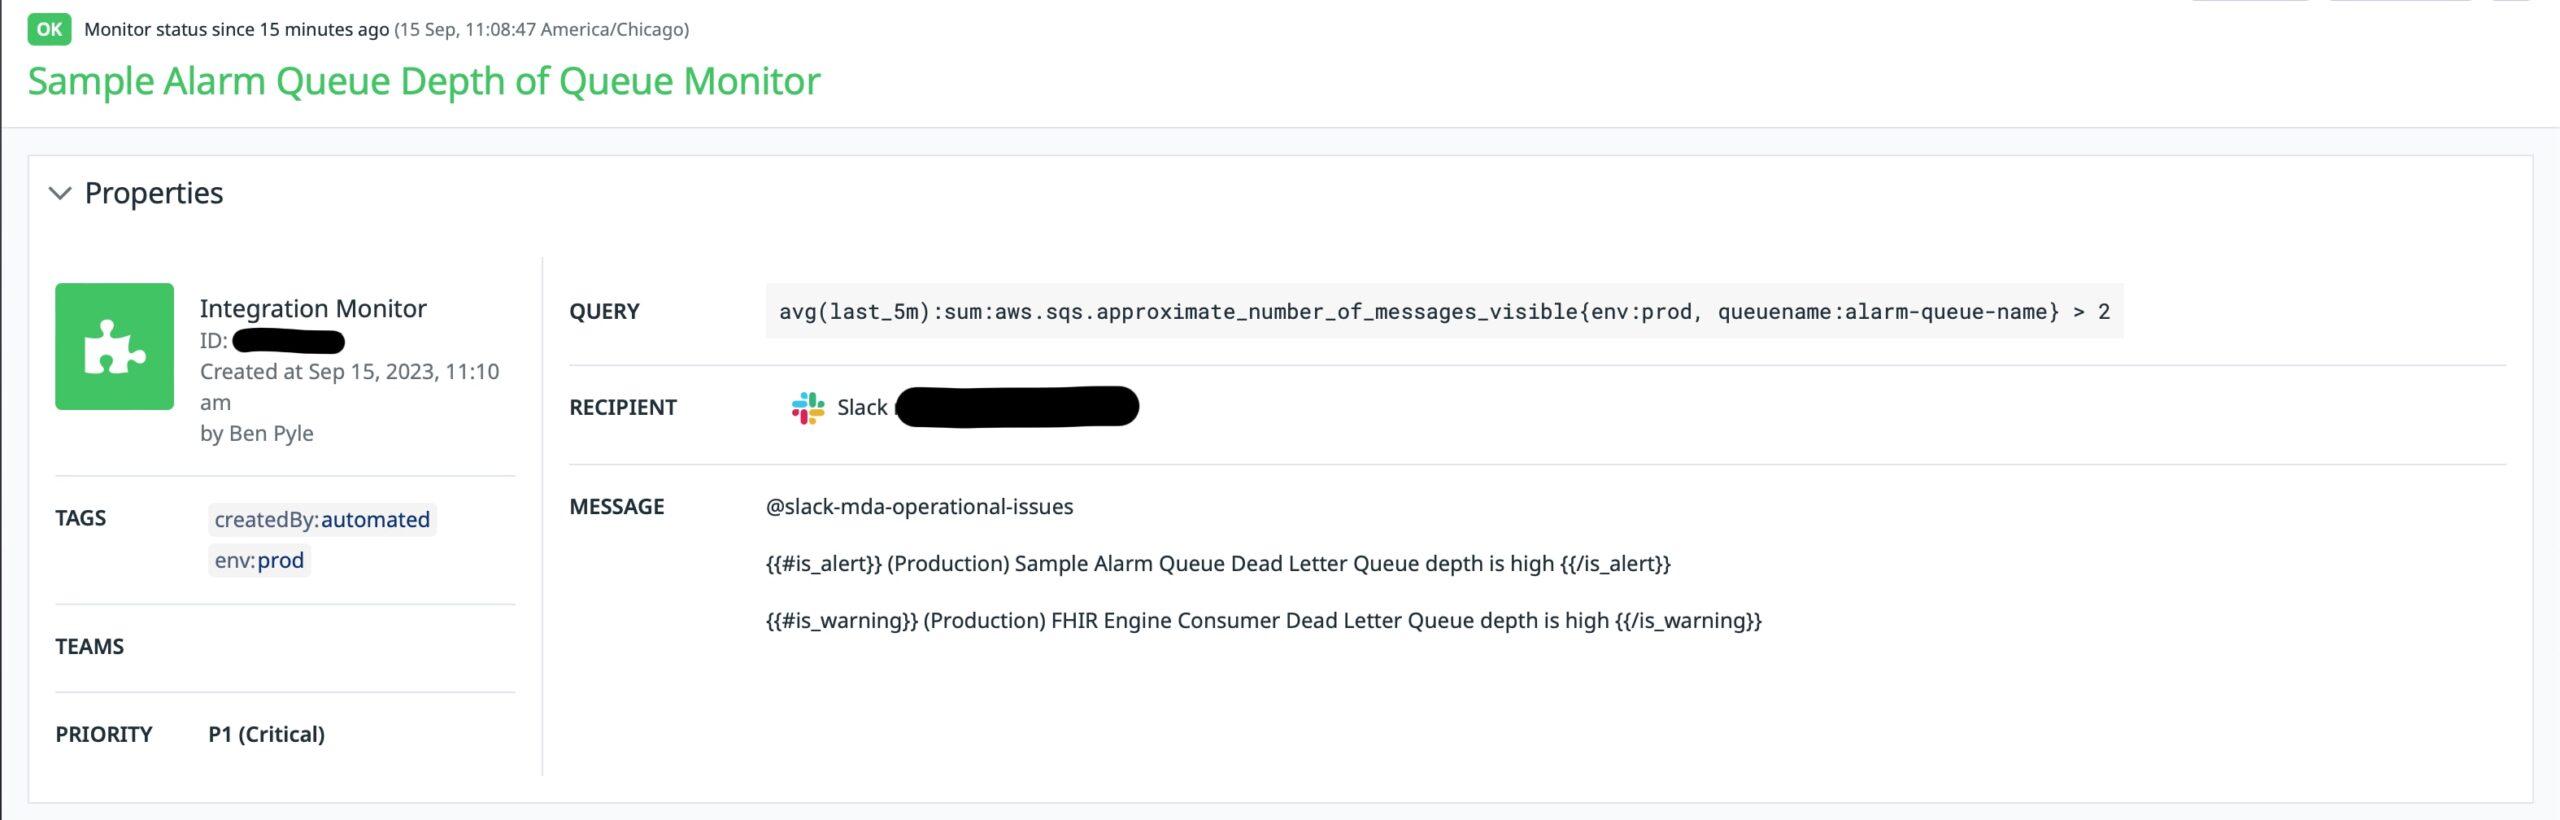
That is a screenshot from Monitoring SQS with a Datadog Monitor that is currently in the “OK” state, hence green. As I get into the build of the alarm, I’ll address more about the parts of it. But how did this alarm get created? Imagine a scenario where you’ve got 100 services with 100 different DLQs that matter. You’d need to add those 1 by 1 and then keep track of them. I’ve been there and what ends up happening is that alarms don’t get built therefore queues don’t get monitored. I wanted to do something better for my teams. I wanted them to be able to include a CDK Construct that could be referenced and leveraged. So let’s get into that.
Datadog Monitor Building
The Export Program
The Datadog team has a TypeScript API Client that wraps their public API for easier consumption. When reading through that code, I decide it would be easy enough to build a simple Node.js console program that would build the Monitor for me that could be executed as part of a deployment. The CDK Deployment Construct will address that in a bit. But first, let’s go through what this NPM Package does.
For reference, here’s the NPM and GitHub repository for the program. The usage of the program is pretty simple.
datadog-sqs-depth-monitor -h
Usage: cdk-asl-definition-extractor [options]

Create a DataDog Monitor that is connected to a Slack Channel

Options:
  -V, --version           output the version number
  -q, --queue <value>     AWS SQS name to monitor depth of queue
  -r, --readable <value>  Readable name for the monitored queue
  -s, --slack <value>     Slack channel to forward alert
  -h, --help              display help for command
The code itself might even be simpler. I could have done this directly in a build with something like cURL but I just wanted a little more formality and repeatability around it all. I didn’t want to have to build these API calls with cURL and honestly using the TypeScript Client was much easier.
The program first finds the monitor if it exists.
export const findMonitor = (
    consoleOptions: ConsoleOptions
): Promise<v1.MonitorSearchResponse> => {
    const monitorName = `${consoleOptions.readableQueueName} Depth of Queue Monitor`;

    const configuration = client.createConfiguration();
    const apiInstance = new v1.MonitorsApi(configuration);
    const params: v1.MonitorsApiSearchMonitorsRequest = {
        query: monitorName,
    };

    return apiInstance.searchMonitors(params);
};
And then creates it if it’s missing.
export const createMonitor = (
    consoleOptions: ConsoleOptions
): Promise<Monitor> => {
    const message = `${consoleOptions.slackChannel} nn{{#is_alert}}n(Production) ${consoleOptions.readableQueueName} Dead Letter Queue depth is highn{{/is_alert}}nn{{#is_warning}}n(Production) FHIR Engine Consumer Dead Letter Queue depth is highn{{/is_warning}}`;
    const escalation = `${consoleOptions.slackChannel} nn(Production) ${consoleOptions.readableQueueName} Dead Letter Queue depth bump`;
    const query = `avg(last_5m):sum:aws.sqs.approximate_number_of_messages_visible{env:prod, queuename:${consoleOptions.queueName}} > 2`;

    const params: v1.MonitorsApiCreateMonitorRequest = {
        body: {
            name: `${consoleOptions.readableQueueName} Depth of Queue Monitor`,
            type: "query alert",
            query: query,
            message: message,
            tags: ["createdBy:automated", "env:prod"],
            priority: 1,
            options: {
                thresholds: {
                    critical: 2.0,
                    warning: 1.0,
                    criticalRecovery: 1.0,
                    warningRecovery: 0.0,
                },
                notifyAudit: false,
                requireFullWindow: false,
                notifyNoData: false,
                renotifyInterval: 30,
                includeTags: false,
                evaluationDelay: 900,
                renotifyStatuses: ["alert"],
                escalationMessage: escalation,
                newHostDelay: 300,
                silenced: {},
            },
            multi: false,
        },
    };

    const configuration = client.createConfiguration();
    const apiInstance = new v1.MonitorsApi(configuration);

    return apiInstance.createMonitor(params);
};
To dig a little further into how it creates it.
The message is a Datadog construct that I’m building a warning and alert body for when those two things are triggered or healed. Right now, I’m using something hard-coded around > 1 is warning and > 2 is alert. I hope to make that configurable moving forward. That message will be posted to the Slack channel supplied as well.
The actual query for the alarm is defined as:
const query = `avg(last_5m):sum:aws.sqs.approximate_number_of_messages_visible{env:prod, queuename:${consoleOptions.queueName}}
This defines that over the last 5 minutes, the monitor will average the sum of the ApproximateNumberOfMessagesVisible AWS metric for my enrivonment marked as prod and the queueName that I specify. Again, the env will be updated to be configurable as well.
Configuration
I mentioned that a few things need to be configured for all of this to work. Having AWS integrated with Datadog and also Slack integrated with Datadog are two key pieces of this puzzle.
The next thing you’ll need to do is create an API Key and an Application Key in Datadog. The console program is expecting environment variables of DD_API_KEY and DD_APP_KEY that get set in the runtime environment. In order to be able use them though, you’ll first need to create them. Walk through that article from Datadog to see how to make that happen. Pay close attention to scopes as including the Monitoring scopes are important.
Including in CI/CD
The automation of infrastructure and code deployment is what ultimately drove me towards building out this solution. I believe that when observability is baked into a deployment, you are more likely going to get the coverage you need when it comes to operating your applications. I’m also of the opinion that you don’t need the same monitors and alarms in development and QA environments so being able to include in just prod or prod-like accounts also makes a ton of sense.
There are many options when it comes to Pipeline building and executing deployments and builds. I generally choose to stick within the AWS CodeSuite of tools. And what I mean by that is the following components:
- CodePipeline: The workflow engine
- CodeBuild: On-demand environments for compiling, running tests or handling other automation
- CodeCommit: Managed Git repositories
- CodeDeploy: Blue/Green, Canary or All-at-once deployment tool for publishing Lambdas, Containers and more
In order to make this more generic, I decided to build a CDK Construct that handles the operation of the Monitor builder above. The output of using it in a CodePipline looks like this:
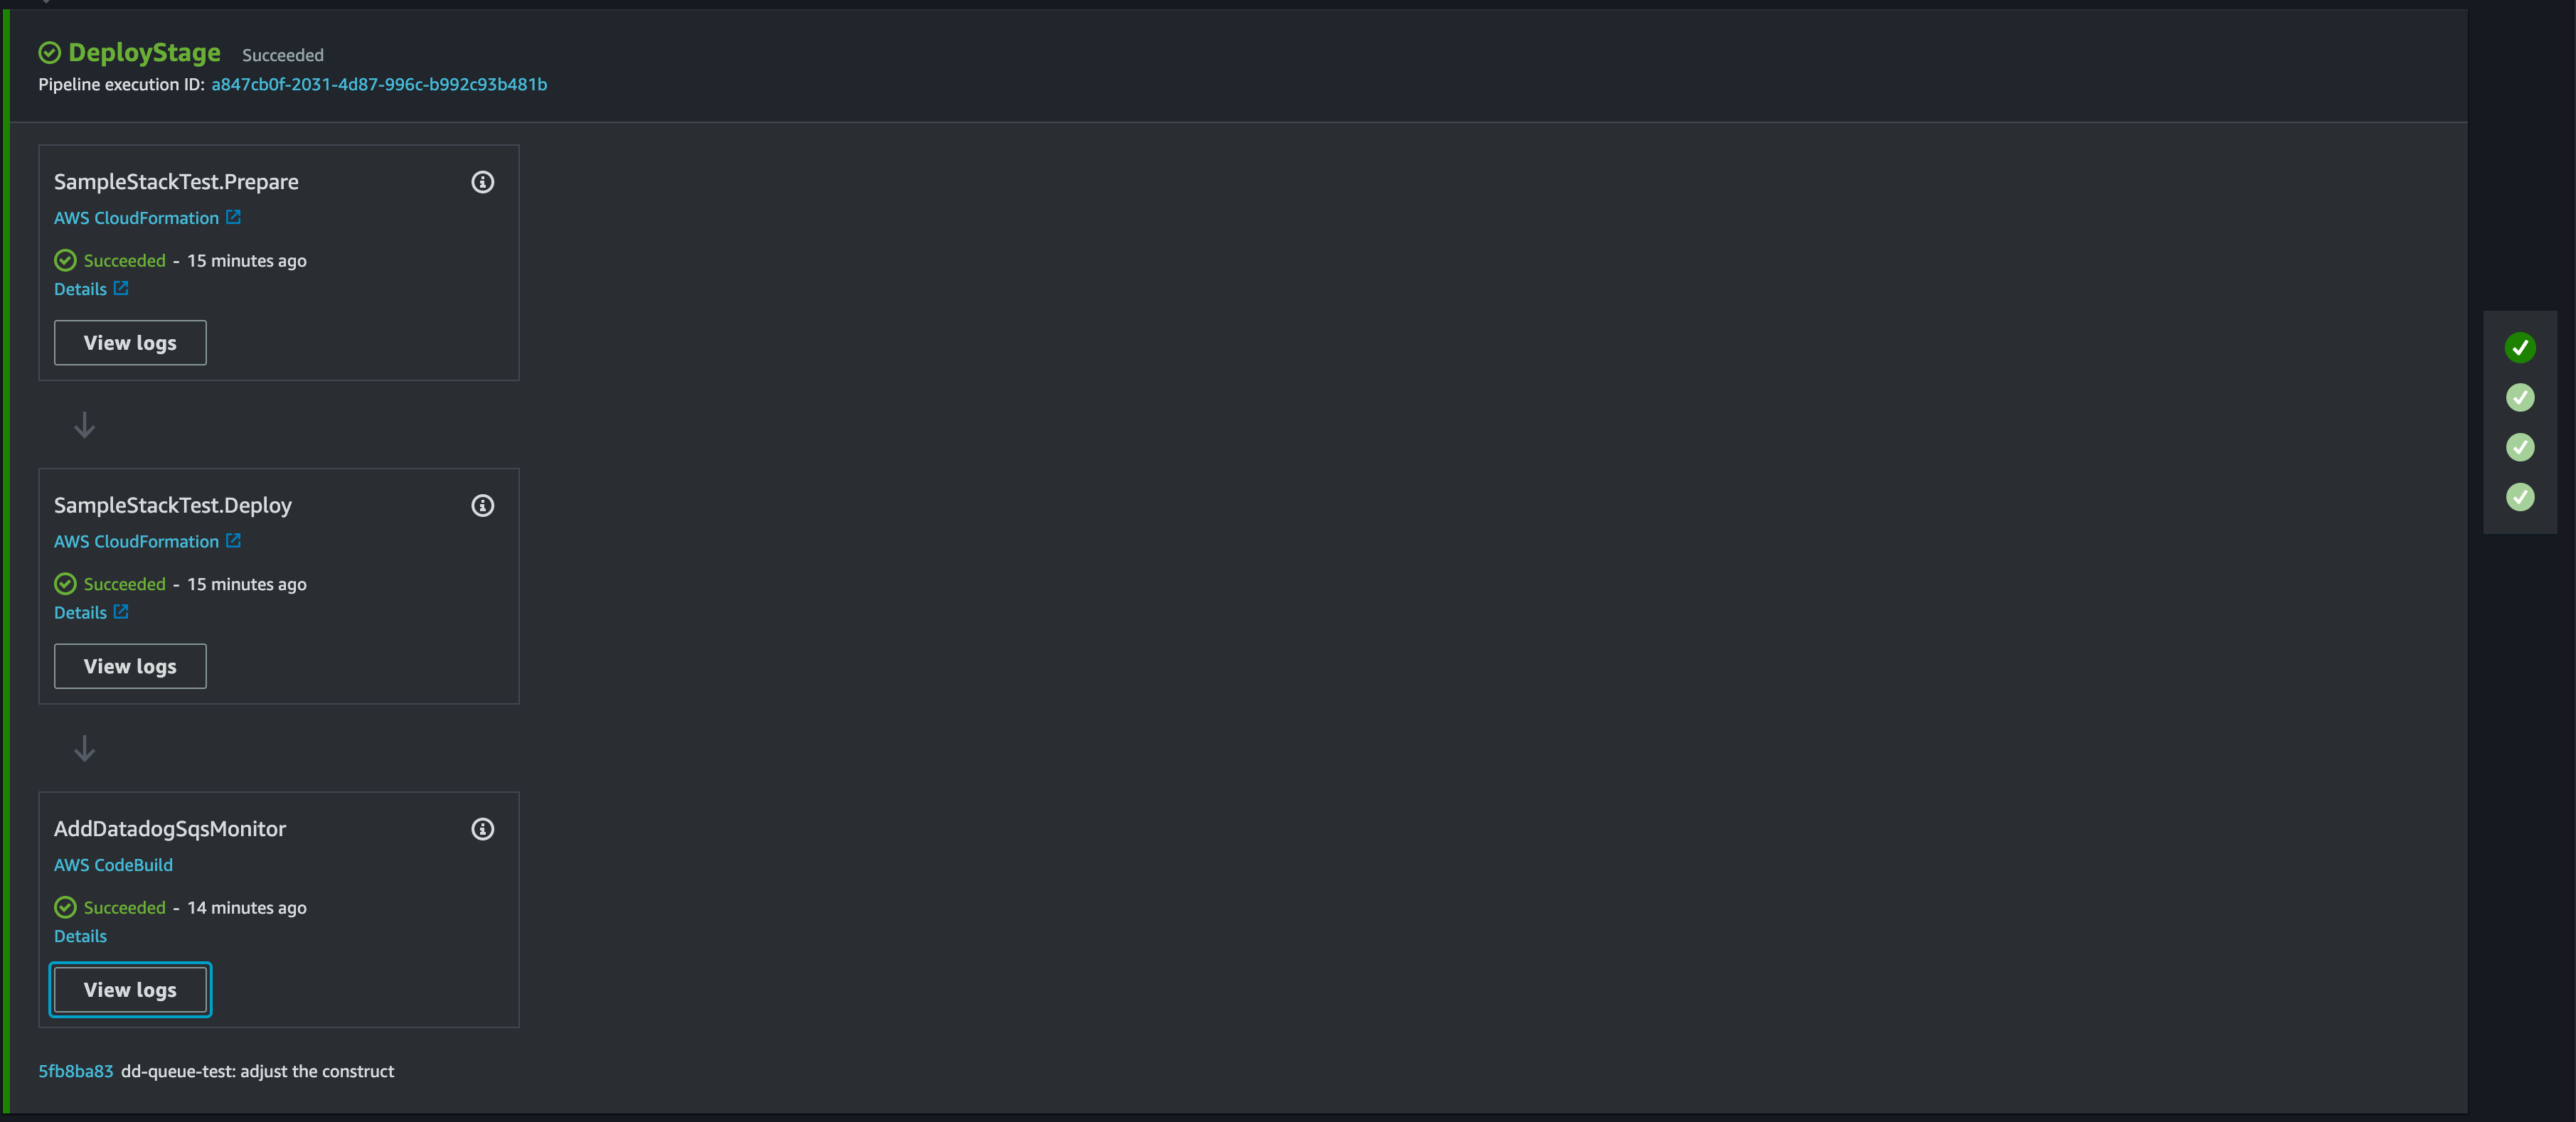
That last step is included in the pipeline and is purely built by this custom construct.
Construct Code
When monitoring SQS with Datadog, I needed to build that monitor as part of the build process. The construct code that does that builds a CDK CodeBuildStep that fetches and executes the Node.js code I showed you above.
export interface CdkQueueDdConstructProps {
    queueName: string;
    readableQueueName: string;
    slackChannel: string;
    datadogApiKeySecret: string;
    datadogAppKeySecret: string;
}

export class CdkQueueDdConstruct extends Construct {
    private readonly _codeBuildStep: CodeBuildStep;

    constructor(scope: Construct, id: string, props: CdkQueueDdConstructProps) {
        super(scope, id);

        this._codeBuildStep = new CodeBuildStep("AddDatadogSqsMonitor", {
            commands: this.buildCommands(props),
            buildEnvironment: {
                buildImage: LinuxBuildImage.STANDARD_7_0,
                environmentVariables: {
                    DD_API_KEY: {
                        value: props.datadogApiKeySecret,
                        type: BuildEnvironmentVariableType.SECRETS_MANAGER,
                    },
                    DD_APP_KEY: {
                        value: props.datadogAppKeySecret,
                        type: BuildEnvironmentVariableType.SECRETS_MANAGER,
                    },
                },
            },
        });
    }

    public get monitorStep(): CodeBuildStep {
        return this._codeBuildStep;
    }

    private buildCommands(props: CdkQueueDdConstructProps): string[] {
        const installDeps = `npm install -g datadog-sqs-depth-monitor`;
        const command = `datadog-sqs-depth-monitor -q ${props.queueName} -r "${props.readableQueueName}" -s "${props.slackChannel}"`;
        return [
            "echo DEPLOYING the Datadog SQS Monitor",
            `${installDeps}`,
            `${command}`,
        ];
    }
}
The extent of the code is that it expects some props which guide the utility to create the monitor for the specific queue with the Slack channel that is triggered. Notice that it does need to reference some AWS Secrets as well. Those secrets can be whatever you want from a naming convention and are supplied into the Construct. The CodeBuildStep will inject those values into the shell as environment variables which will enable the monitor program to authenticate with the Datadog API.
Using in a CDK Project
Monitoring SQS with Datadog is easy to achieve when you extend the artifacts above into a CodePipeline project. For instance, I can add the CodeBuildStep from the above CDK Construct onto an existing Stage Deployment of a CodePipeline.
let stage = new PipelineAppStage(this, "DeployStage", {});

let stageDeployment = pipeline.addStage(stage);
let queueConstruct = new CdkQueueDdConstruct(this, `QueueStage`, {
    queueName: "alarm-queue-name",
    readableQueueName: "Sample Alarm Queue",
    slackChannel: "@slack-operational-issues",
    datadogApiKeySecret: "dd-api:DD_API_KEY",
    datadogAppKeySecret: "dd-api:DD_APP_KEY",
});

stageDeployment.addPost(queueConstruct.monitorStep);
That code brings together the construct and the values that it needs in order to do its job. And then by adding a post step to the stage, the CodeBuild project will now run after your deployment as been accomplished. From a developer and team standpoint, this is much easier to add into a project than the code I have above to build the monitor and add it into an existing project. I also get much better adoption this way!
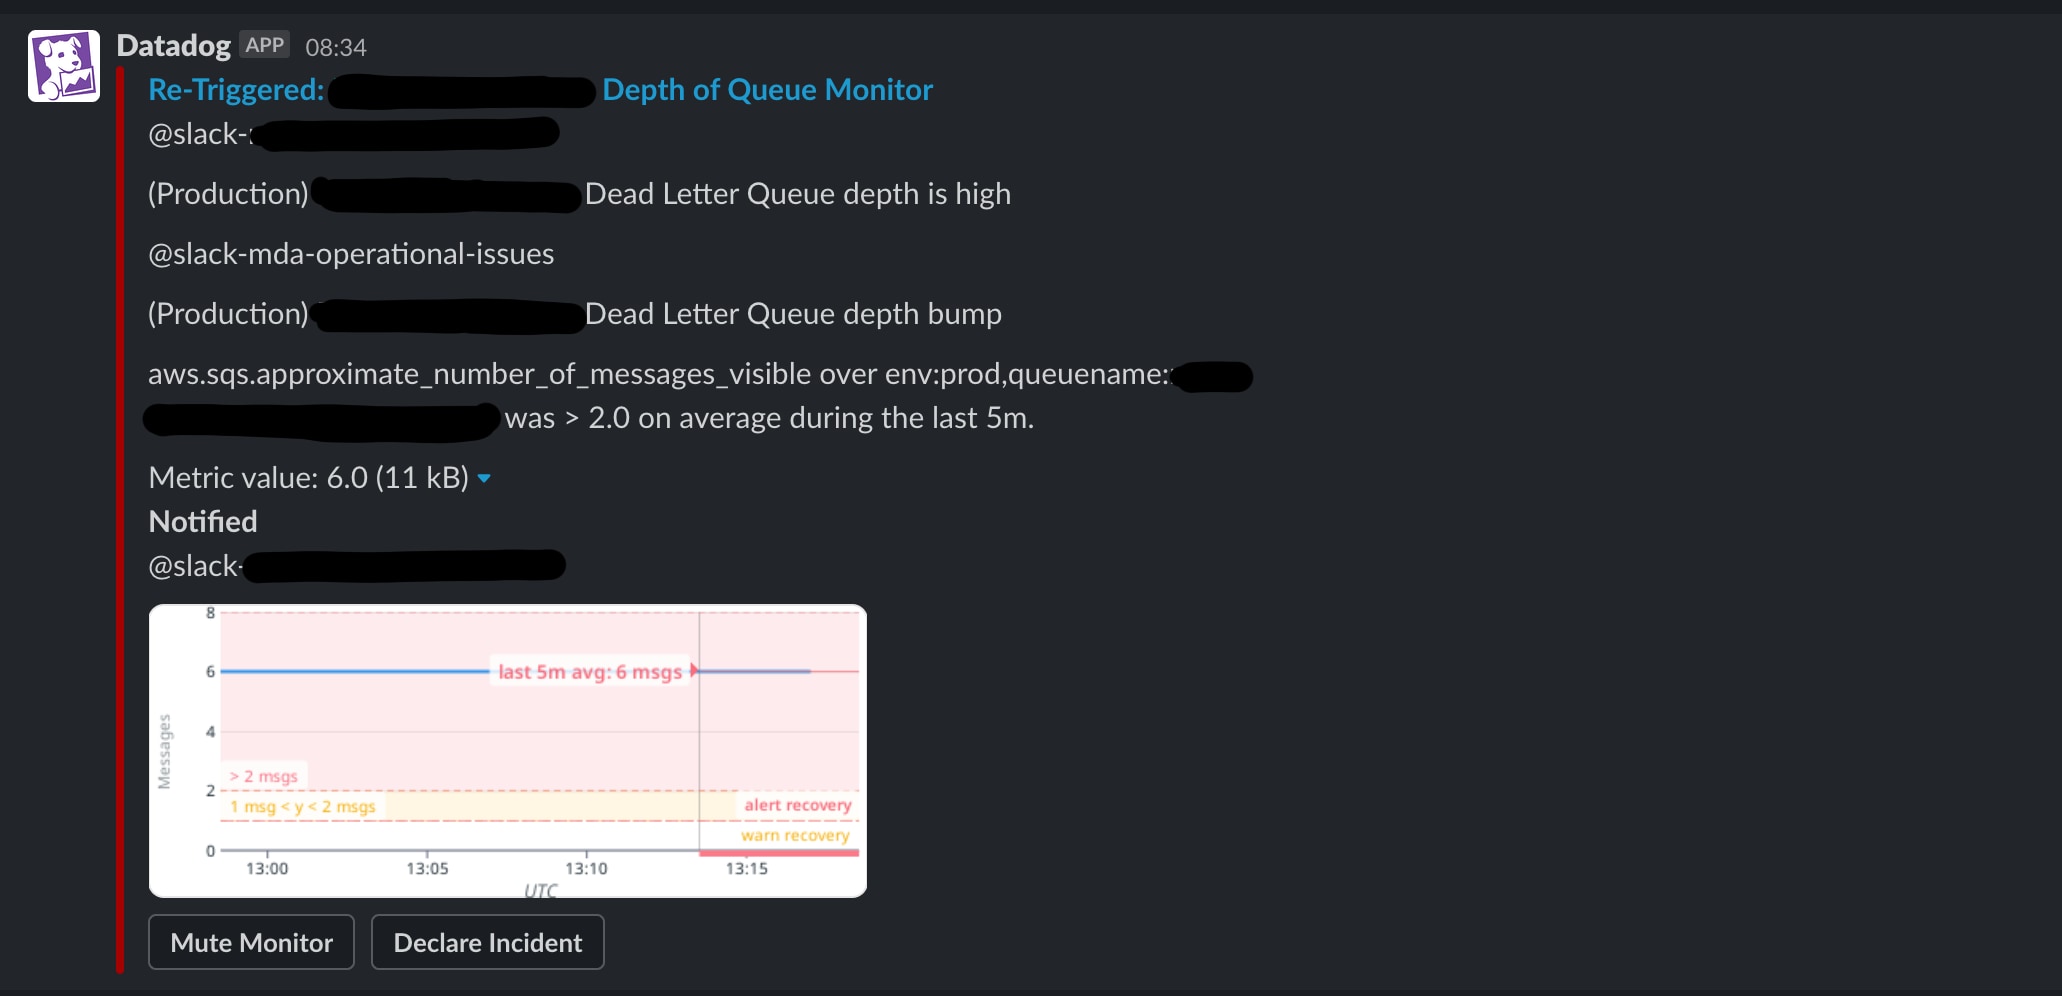
When you implement this all together, you’ll get something in Slack that alerts you when things go wrong.
Wrapping up
My hope is that I’ve shown you an approach and given you some tools that’ll help with Monitoring SQS with Datadog. I’ve got a few repositories and package links to include that you can fork, use and build upon.
There are lots of ways and tools that you can use to go about solving this problem. But things I really want you to take away from this article are this.
- Observability is easier to build into a pipeline than it is to do manually if you are striving for consistency and repeatability.
- Errors and failures will happen in the cloud. Design for them and design for paying attention to them.
- Datadog is more than APM. A LOT MORE. Check it out if you haven’t.
Enjoy! And Happy Building!